Graphical Python profiling with gprof2dot
In this article, I'll talk a bit about Python profiling. If you don't know yet about cProfile, you can check the Python doc here. It a very powerful tool, allowing you to check for bottlenecks in your code, time functions, etc. Basically, you run your Python code using the command
python -m cProfile -o profiled main.py
And then, you'll have an output like this:
ncalls  tottime  percall  cumtime  percall filename:lineno(function)
6986    0.022    0.000    0.022    0.000 {method 'reduce' of 'numpy.ufunc' objects}
   3    0.000    0.000    0.000    0.000 {built-in method _socket.inet_aton}
  40    0.000    0.000    0.000    0.000 {method 'random_sample' of 'mtrand.RandomState' objects}
  40    0.000    0.000    0.000    0.000 {method 'randint' of 'mtrand.RandomState' objects}
   1    0.000    0.000    0.000    0.000 {built-in method _hashlib.openssl_md5}
   1    0.000    0.000    0.000    0.000 {built-in method _hashlib.openssl_sha1}
   1    0.000    0.000    0.000    0.000 {built-in method _hashlib.openssl_sha224}
   1    0.000    0.000    0.000    0.000 {built-in method _hashlib.openssl_sha256}
   1    0.000    0.000    0.000    0.000 {built-in method _hashlib.openssl_sha384}
   1    0.000    0.000    0.000    0.000 {built-in method _hashlib.openssl_sha512}
   2    0.000    0.000    0.000    0.000 {method 'from_buffer' of '_ctypes.PyCArrayType' objects}
  36    0.000    0.000    0.000    0.000 {built-in method _ctypes.POINTER}
   2    0.000    0.000    0.000    0.000 {built-in method _ctypes.pointer}
   1    0.000    0.000    0.000    0.000 {built-in method _ctypes.LoadLibrary}
  36    0.000    0.000    0.000    0.000 {built-in method _ctypes.sizeof}
You can then order the results, in order to sort by cumulative time, number of calls, etc.
This is a great tool indeed, but it can be a bit hard to read sometimes, even after filtering. I was looking for a graphical visualisation, allowing me to easier track wasted time in my code. I came across gprof2dot, which takes a cProfile file as its input, and outputs a configurable graph. Using the default command
python -m cProfile -o profiled main.py
gprof2dot.exe -f pstats profiled | dot.exe -Tpng -o output.png
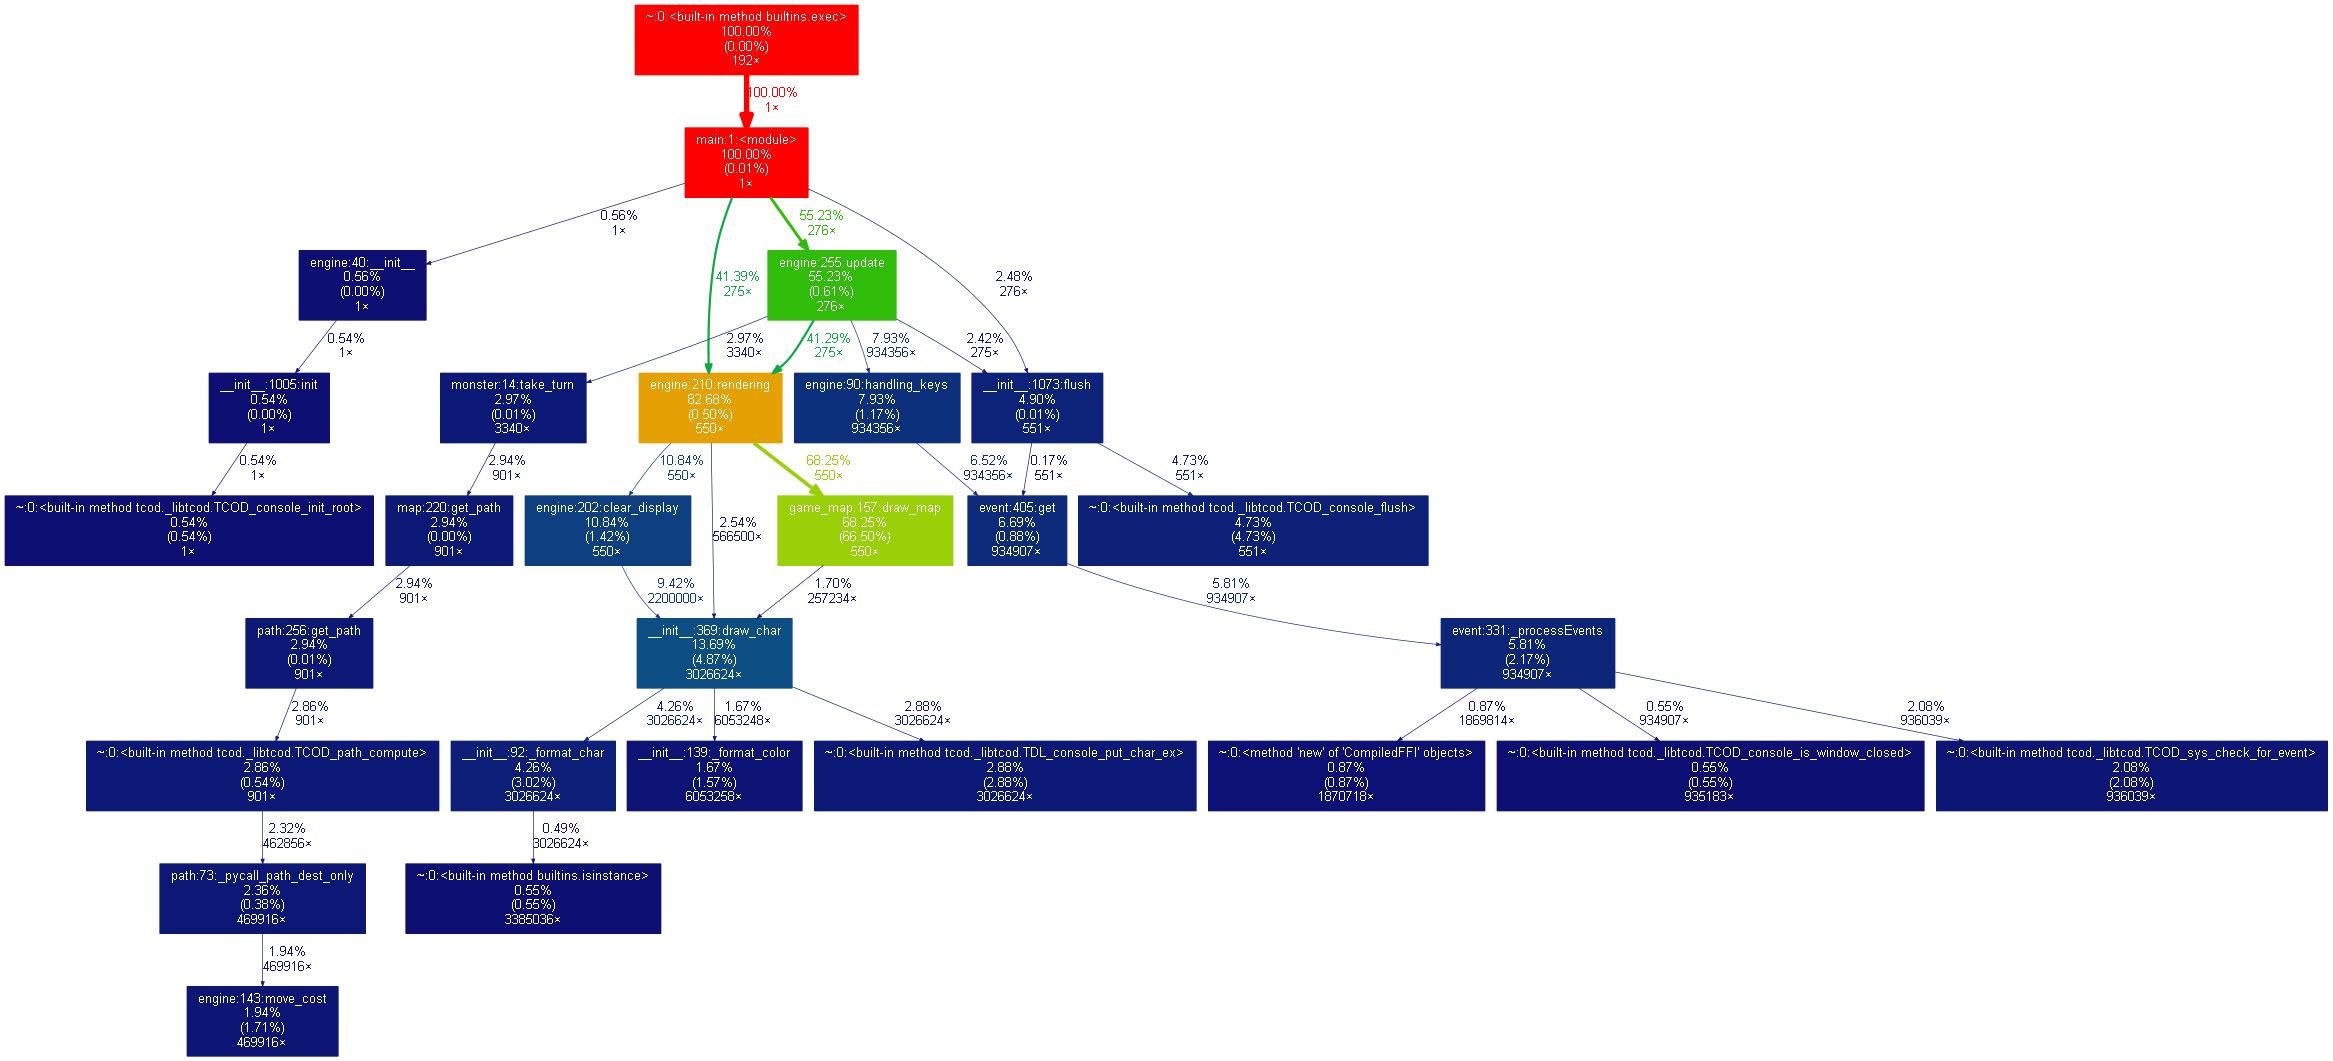
I was able to obtain a nice graph looking like this:

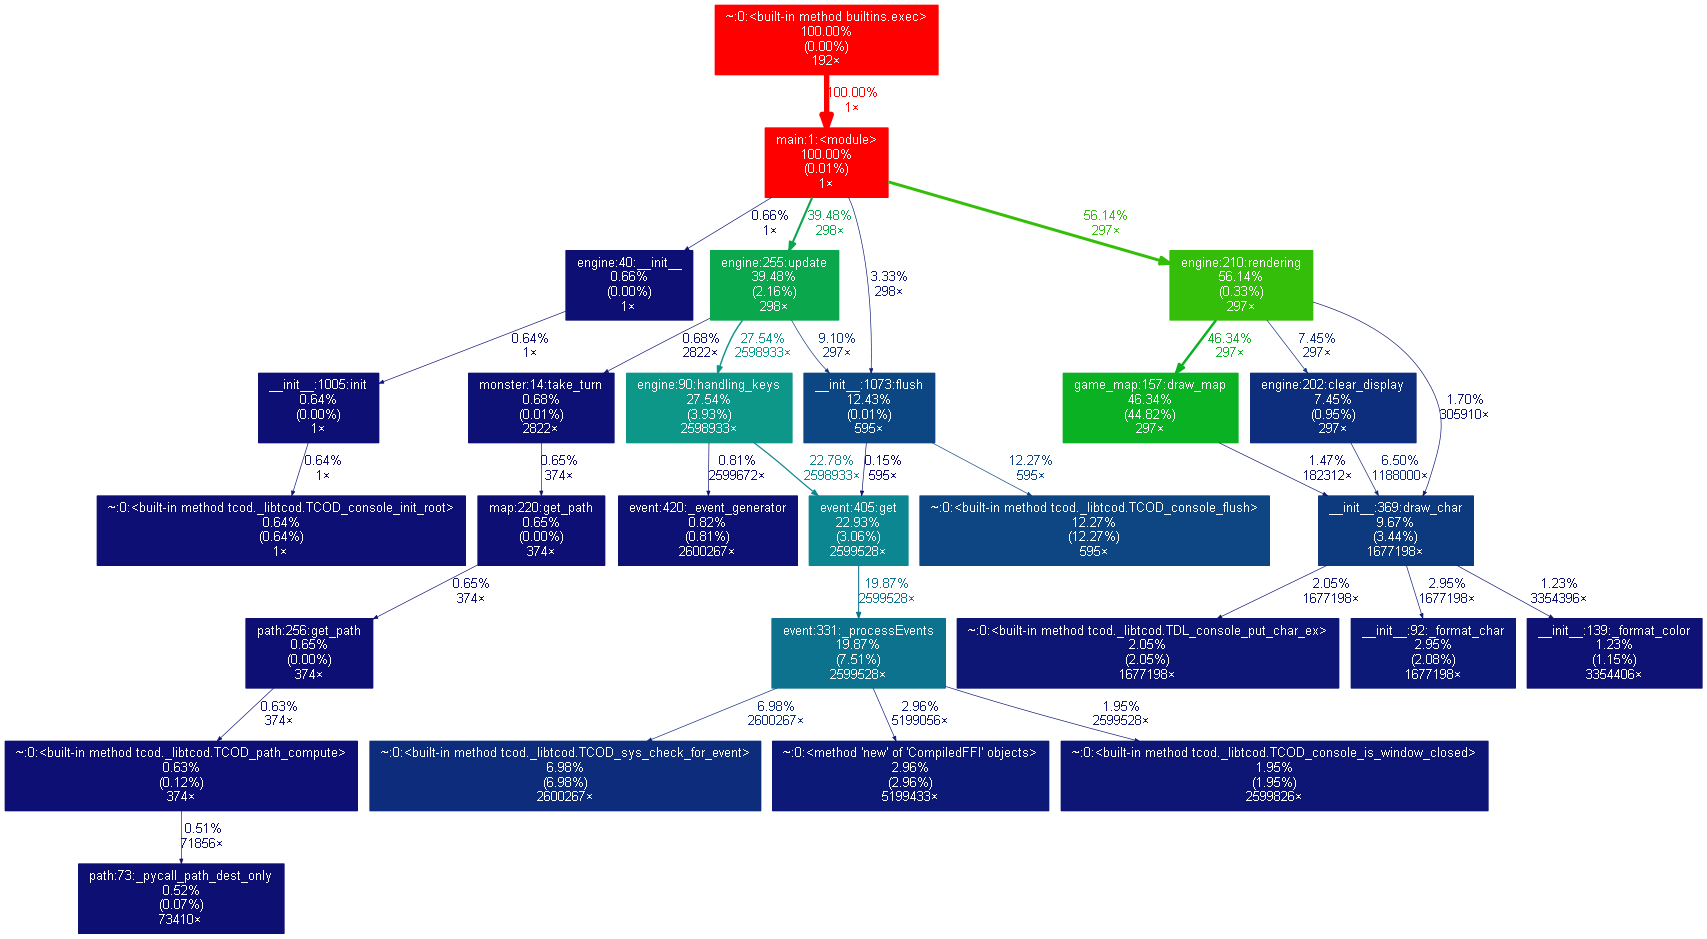
In this case, I'm developping a Roguelike and everytime I moved, there was a delay between the key press and the rendering. Can you find what the problem seems to be? (the answer is at the end of this article) After fixing the problem, the game run at a much more acceptable speed. Here is the second output graph:

Indeed, it is possible to further customise the output graph (I'm not covering this here). This is a very powerful tool, allowing to check the ressources used by (and also to check the workflow of) your program. Oh, and here's the answer to the problem: the rendering function was called 2 times for each update, once by the update function, once by the main loop :)
Cheers!